
Florida Community Innovation (FCI) is a nonprofit based in Florida that empowers young innovators to build social services technologies for their communities and engage in public service projects. FCI’s projects include the Florida Community Resource Map – which will match Floridians in need to food banks, job resources, and more – as well as a certification for anti-human trafficking trainings, a historical education app for cemeteries, and more.
This blog post was written by a group of FCI interns. Support our work!


What is a Data Walk?
In 2023, FCI’s student interns at University of Florida (receiving course credit from the Bob Graham Center for Public Service) decided to host a Data Walk. These students (the authors of this post!) wanted to learn a little bit more about Gainesville. Local neighborhoods are the essential foundations of societies, fostering a sense of belonging and identity. With this Data Walk, we sought to get to know the community in our own backyard.
A Data Walk offers an interactive platform for citizens to openly engage in dialogue concerning research findings that shed light on the strengths, challenges, and opportunities of their community. In many cities, such as Gainesville, these findings relate to the age distribution of the population, traffic patterns, and the most common crimes committed.
However, despite this data being publicly available, most of us don’t know much about the city we live in, including the composition of the community, Gainesville’s overall safety ranking, and most common public grievances.
Exploring data-driven insights helps us have meaningful conversations that can help drive policy or procedure changes, cultural changes, and or organizational shifts in perspectives.
We at Florida Community Innovation made it our goal to break down Gainesville’s data to understand the community, analyzing it piece by piece with compelling data visualizations.
So we did a Data Walk…
A Data Walk is simple: invested citizens find trends in public data, come together, and build a nuanced picture of their community. Thanks to the mentorship of our executive director, Caroline Nickerson, who led us every step of the way and even helped us outline and edit this post (hi, Caroline!), we formulated a plan. Our first step was to meet with Natalie Tucker, the Vice President and Academic Dean at Marian University, who originated the concept of the data walk, and she helped us understand best practices for engaging members of the public with data.

Enthusiastic to learn more about Gainesville, we then turned to dataGNV – the city of Gainesville’s open data portal – making visualizations and using them to draw conclusions about our community.
On April 12, 2023, we gathered to showcase the charts and graphs made with Gainesville’s data. Guests from the City of Gainesville and CodeGNV, a local group of volunteer software engineers and professionals that is now part of FCI, gave advice and provided context regarding the inner workings of the data itself.
Students also gave constructive criticism to each other to refine each visualization. All the attendees of the Data Walk wandered the room, putting sticky notes with their thoughts on the various visualizations. These sticky notes then provided the foundation for a group conversation about the use of data as a decision making tool.
However, data isn’t everything. Often, more context is necessary to truly understand the nuance of a situation. We addressed a variety of topics in our data walk, including crime statistics. In one case, a dataset showed a large plurality of crimes were committed around midnight, relative to other times of day. However, a city official let us know this was due to many police officers reporting crime at the default time: 12 am. Therefore, the data is likely not a true reflection of when crimes are committed in Gainesville.
In another case, one of our visualizations showed a correlation between arrests and total population in some age groups, suggesting that a worryingly large portion of Gainesville are criminals. However, upon further research and discussion, we found this disparity was due to arrest data counting multiple charges for one person as multiple arrests, leading to confusion on the interpretation.
Without the insight of the Data Walk, these assumptions could’ve gone unchecked, highlighting how crucial context can be found through collaboration.
A Look at Criminal Offenses
Abhi Bommineni

Using data from Gainesville Police Department, I created a visualization of the occurrence of criminal offenses by the day of the week. The number of offenses increased throughout the week, peaking on Friday and then dropping during the weekend. One theory is that Gainesville residents are more likely to encounter crime when they venture into public places for work, unlike during the weekend when many stay at home.
Another dataset – focusing on crime reports – nicely matches the above criminal offenses data on the weekend. The same cannot be observed for the workweek. Instead of the incline seen in the criminal offenses data, crime reports are spread out evenly. This difference could be linked to the nature of crimes: if some crimes take longer to report than others, the frequency of these different crimes could influence the distribution.
After being presented with this visualization, Gainesville residents had several questions. Curious about crime distribution on a large scale, residents wanted to know if certain weeks or years had more crimes. Indeed, a crime frequency analysis over longer periods could be an interesting avenue for future research. Trends in crime could then be linked to the socio-political environment during those periods.
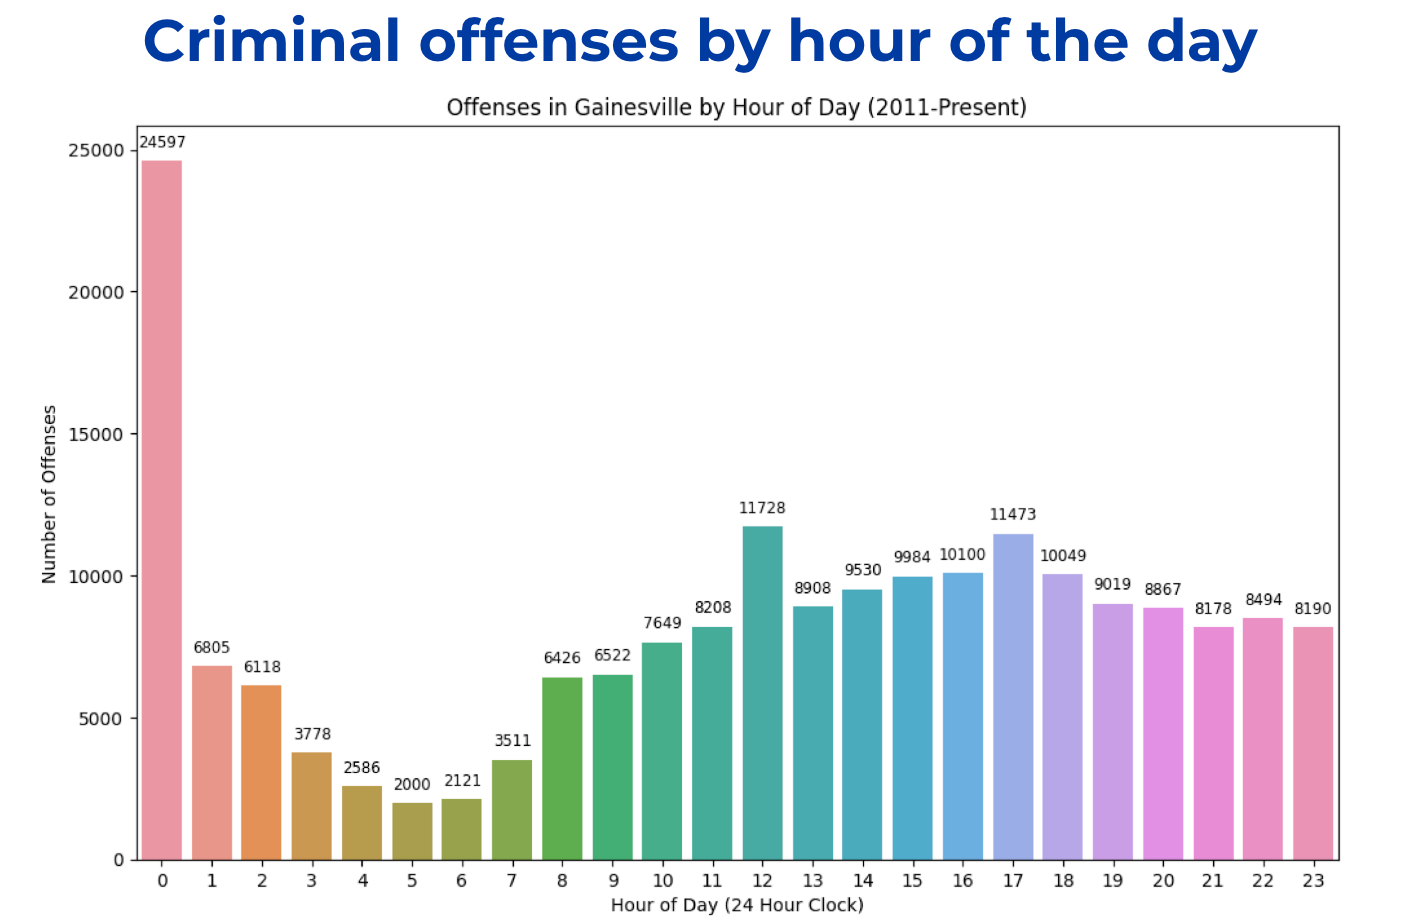
When our guests encountered this criminal offenses by hour graph, they were struck by the large spike of offenses at midnight. This spike is followed by a dip through the early hours of the morning, with smaller peaks at noon and 5 pm.
Throughout the data-walk, people were curious about the midnight spike, and speculated on several possible explanations. Were crimes planned to be at midnight, or were police simply less active? According to a city official, 12 am was simply the default reporting time for Gainesville police officers. Many crimes were “committed” at midnight according to the database, but this gives evidence that this data is not reflective of an actual uptake in criminal activity. This discrepancy shows why events like data walks are so important. Data analysts like the students at FCI can be the intermediary between the government and the people, finding relevant trends and narratives in the raw data and clearing up confusion through rational discourse.
The increases in reported crime at noon and 5 pm could be attributed to the lunch break and end of the workday. At these times, workers typically leave their offices and venture into public areas – increasing the amount of people capable of both observing and engaging in illicit activity.
The data is fairly evenly distributed from 9 am through 7 pm, while reported crimes decrease during the early morning. This makes sense; people are more likely to report crimes when they are awake and active. This is also when transportation and methods of communication are more readily available.
Residents wished to learn more about the locations and times crimes were being committed. Through these insightful questions, the data walk helps our students further prepare for future data analysis and visualizations. Understanding the underlying factors between time and crime will help citizens develop smart solutions. Linking location to the times of reporting may be helpful for determining what influences crime rates, helping citizens and lawmakers find solutions to make our communities safer, while also looking at unconscious biases that affect reporting.

As crime is quite complex, a number of policies and laws could be possible solutions. Depending on the factors at play, reducing or increasing policing, increasing access to education and job training, creating more robust mental health and substance abuse treatment programs, and other measures could be helpful. At this stage, both further data analysis and qualitative research must be done to determine which steps exactly are the correct plan of action.
Car-on-Pedestrian Crashes in Gainesville
Qingyu Yang

Southwest Gainesville has the highest frequency of car-on-pedestrian crashes, highlighting an area for Gainesville officials to address pedestrian safety. According to an analysis of streets and car-on-pedestrian crashes since 2011, SW ARCHER RD had the most within the city of Gainesville, at 5202. This is about the double amount of the street with the next most collisions, SW 34th ST.
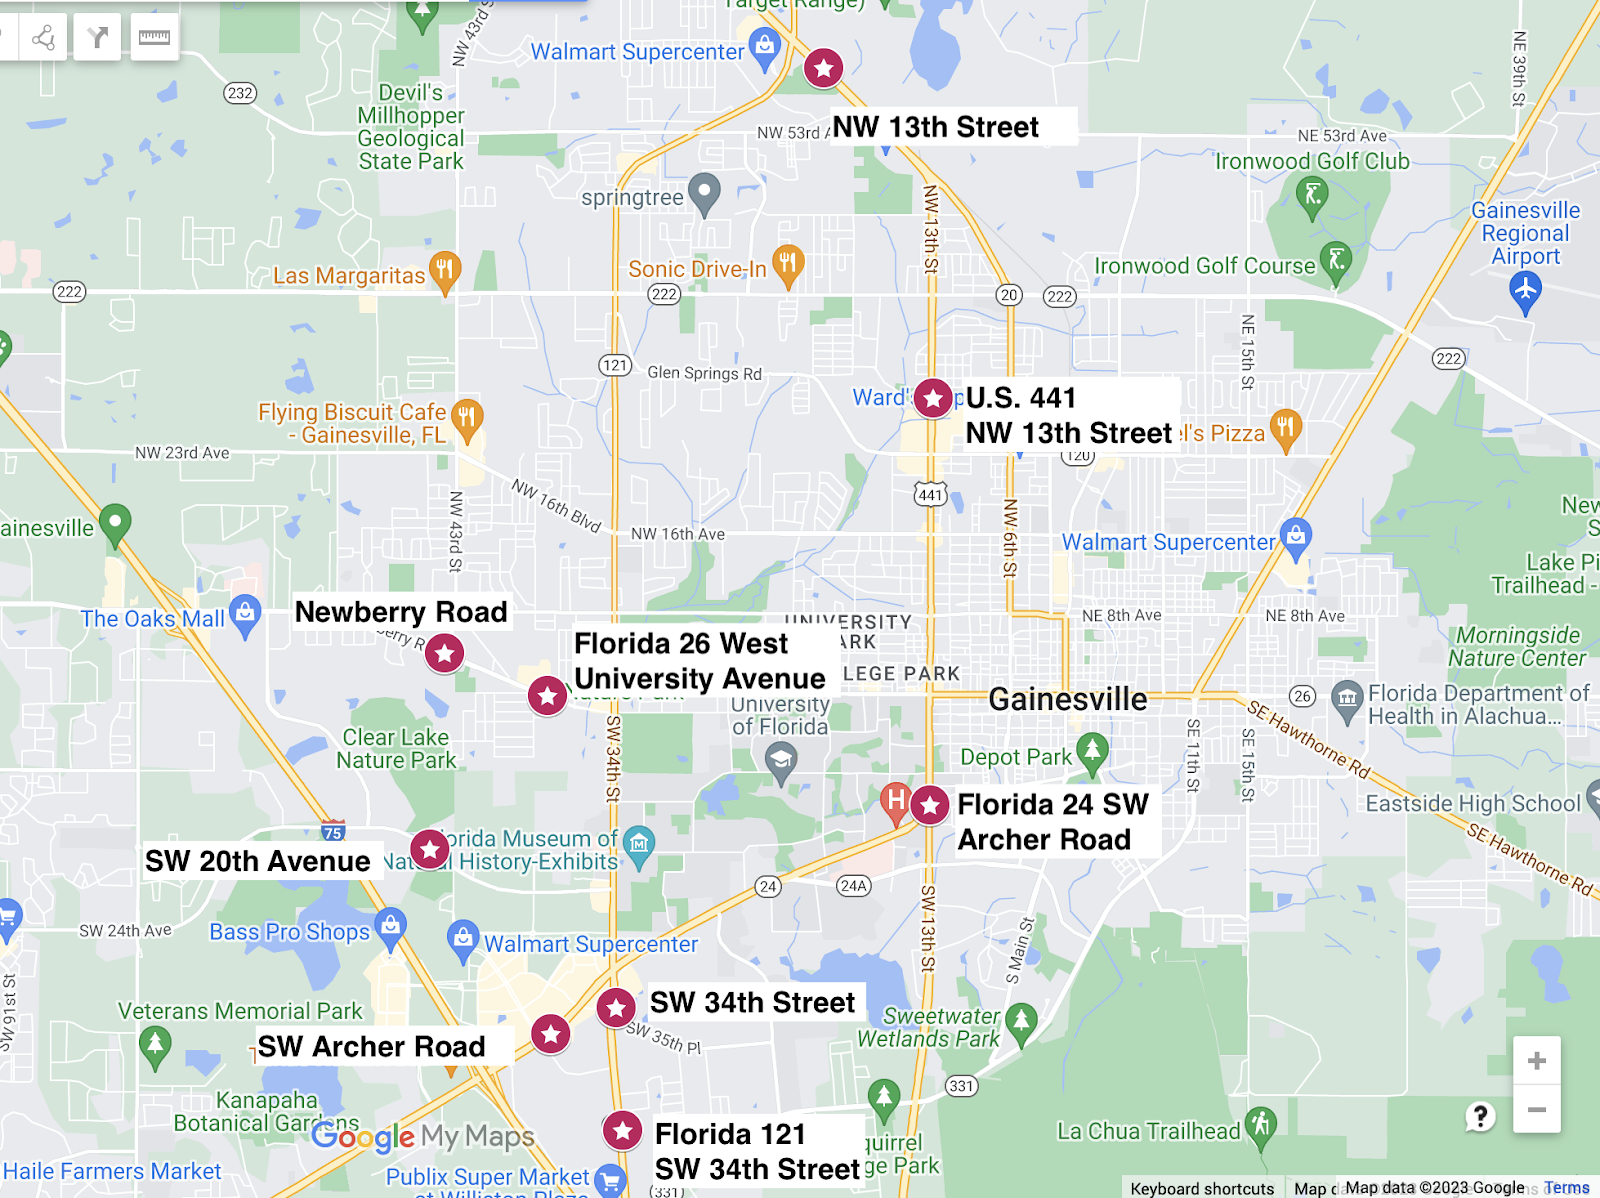
According to a map of the most collision prone areas, the southwest part of Gainesville had a higher frequency of crashes, as three of the top ten addresses were located in this area. Additionally, areas near road intersections have a greater possibility of a crash with pedestrians.
During the data walk, I received many interesting, constructive comments on my work. Comments include changing the “traffic crashes” phrase to “car-on-pedestrian”, as this graph provides insights for officials on the pedestrian safety issue in Gainesville. With this data, city officials can create solutions to reduce these pedestrian accidents, building trust between the City of Gainesville and the people, while more importantly saving lives. As SW ARCHER RD is located right under the University of Florida campus, future research could focus on investigating this location’s propensity for crashes.


When looking at the time of day, we observed that accidents occur most frequently during commuting times, especially in the afternoon when people get off work. According to the Car-on-Pedestrian Collisions by Day-of-Week graph, crashes are more frequent on weekdays.
When observed as a whole, the data shows that accidents usually take place during the rush-hour traffic. Future researchers can compare this trend to other counties in Florida, comparing the distribution of rush-hour traffic between regions.
There are many possible reasons behind the increase in crash frequency at 5pm, including fatigue, distracted driving, or simply traffic congestion. These variables could be assessed in future research; another possible topic could be a comparison of the frequency of crashes at rush hour vs. midnight, when more drunk driving would occur. For a study like this, it would help to look at crashes in relation to total traffic, allowing one see if people have a higher propensity to crash at certain times, or there is just more traffic.


From the Fire Rescue Response Type Since 2012 by Percent graph, the Emergency Medical Services is the most frequent fire rescue response type in Gainesville, accounting for 77% of total fire rescue requests. One commenter mentioned that we could explore how age could affect this result. Florida, known for its retirement communities, might have a greater percent of Emergency Medical Services responses compared to other states that have younger populations. On the other hand, Gainesville has a large young-adult population due to the University, so it is possible that the high frequency of EMS responses is due to partying, substance use, and other reckless activities commonly associated with college towns. In both of these cases, generalizations are used to explain data, but the only way to find a concrete answer is through more in depth analysis (ex. studying the specific reasons behind EMS calls and the ages of those harmed).
Age and Arrests
Holden Alpern
The Data at a Glance


Conclusions on Age Distribution

According to the data, Gainesville’s older citizens accrue significantly less arrest charges than its younger population, with the exception of the 15-20 year-old group. This may be due to younger people being more likely to commit crimes, more likely to be targeted by the police, or more likely to be arrested for crimes with multiple charges. The cutoff point, where the proportion of the arrest charges equals the proportion of the total population, is around age 55. Gainesville citizens ages 55 and up are underrepresented in charges compared to the total population, while citizens ages 20 and 55 are overrepresented.
As noted in the introduction, in the raw data from DataGNV, the source of this visualization, arrest charges are marked individually, even if they come from the same arrest, limiting the conclusions that can be made. The data claims younger people receive the most arrest charges, but the true likelihood of a group to be arrested is not shown. Future research presents a possibility to find such statistics through further, more rigorous analysis – matching case numbers to combine charges into the arrests which they came from. In addition, this could be compared with data from the UFPD for a more holistic picture of crimes in Gainesville.
Regardless, there is little doubt, especially in a college town such as Gainesville, that the average arrestee is probably on the younger side. This could possibly lead to stereotyping when police officers have several suspects for a crime, during traffic stops, and other encounters. Younger people could be profiled as more likely to be criminals, and while this is presumably true, police work based on assumptions gives power to false accusations and can harm innocent people.
A Bird’s Eye View
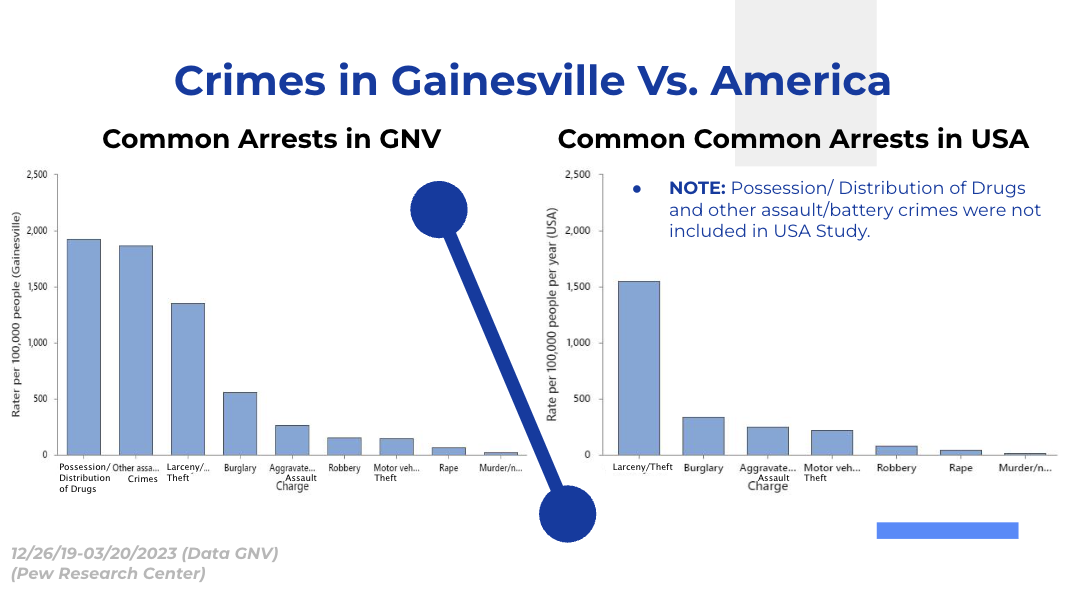
This graph compares charges in Gainesville and the United States. The visualization shows larceny/theft as being more common nationally, and burglary and murder as more common in Gainesville. Significance could again be called into question due to Gainesville data separating charges from the same arrest, as it is unknown if the Pew Research Center’s data for the United States is per arrest or per charge. One interesting conclusion involves murder. Because almost all murder arrests in Gainesville fall under the same charge, the question regarding the Pew data is less relevant to the conclusions. According to the data, murder charges (and therefore murder arrests) are about five times more common in Gainesville than the greater United States; future research can show causes behind this correlation, or any other unforeseen factors affecting it.

Safety and Arrest Demographics
Muning Chen
Higher Income Gainesville Residents Feel Safer in Their Neighborhoods
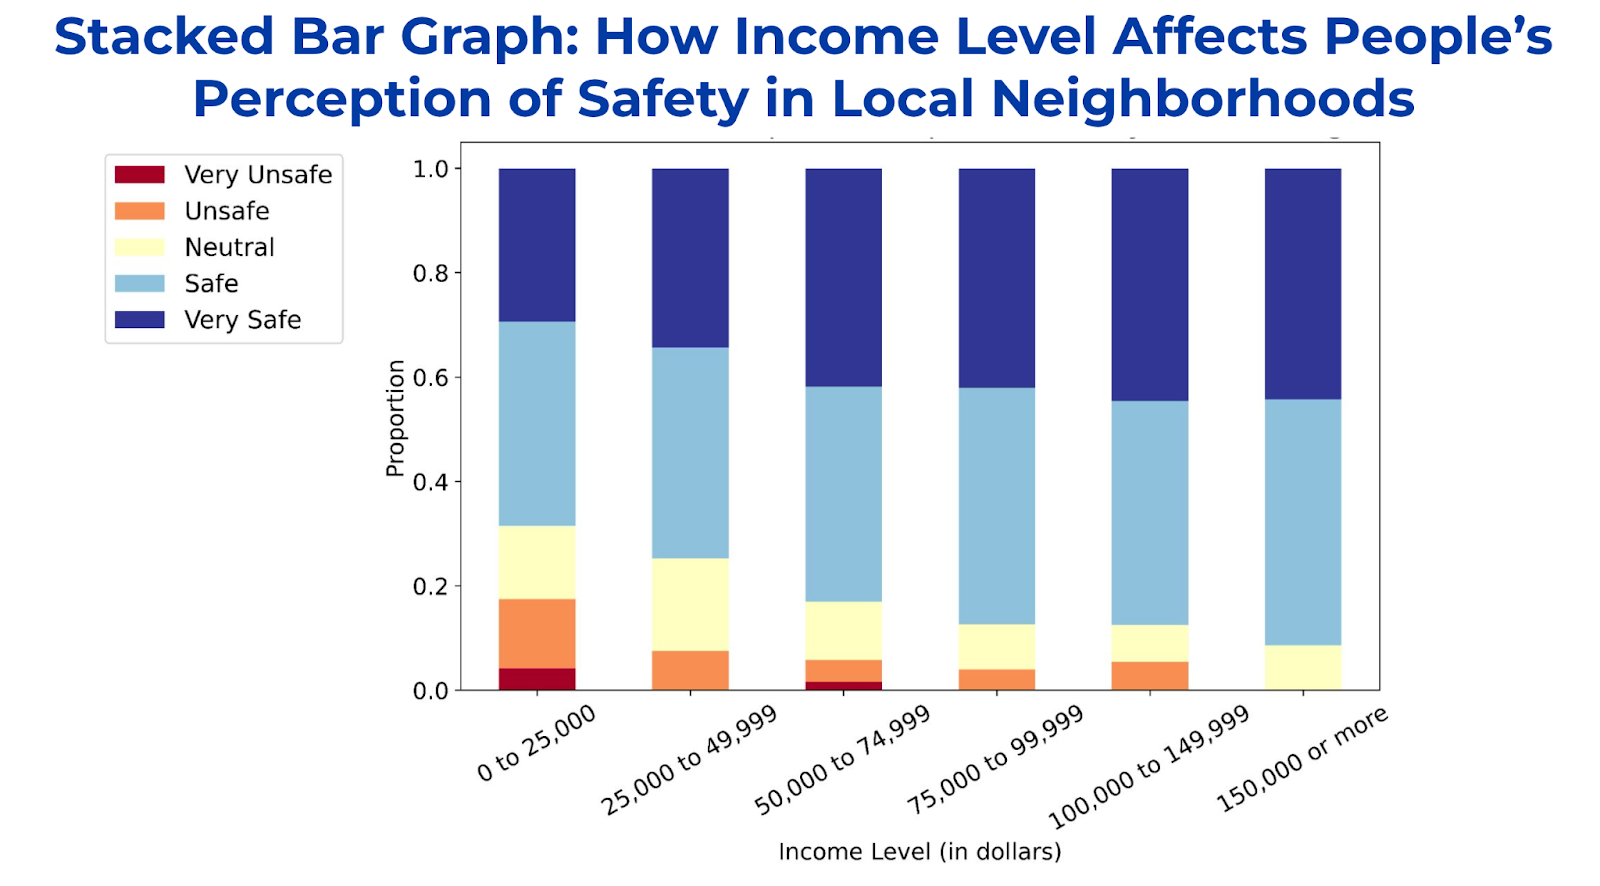
Higher income Gainesville residents reported feeling safer in their neighborhoods, according to the 2021 Gainesville Neighborhood Survey. The survey randomly selected 1,000 residents, who reported their annual household income and safety scores for their respective neighborhoods. The correlation between income and perceived safety may be attributed to better resources, infrastructure, and management offices in higher income neighborhoods.
One commenter noted that higher-income individuals may also have a safety net for difficult situations, such as emergency funds, which highlights how socioeconomic status can influence perceptions of safety. To promote a greater feeling of safety among lower income residents, the city should address those economic needs and address crime in those neighborhoods. For example, the city could offer financial assistance to individuals and families to help them access safer, higher-quality housing. Improvements to infrastructure and resources in currently underserved communities could also help residents to feel safer in Gainesville. This might include upgrading street lighting, improving sidewalks and bike paths, and increasing access to public transportation.
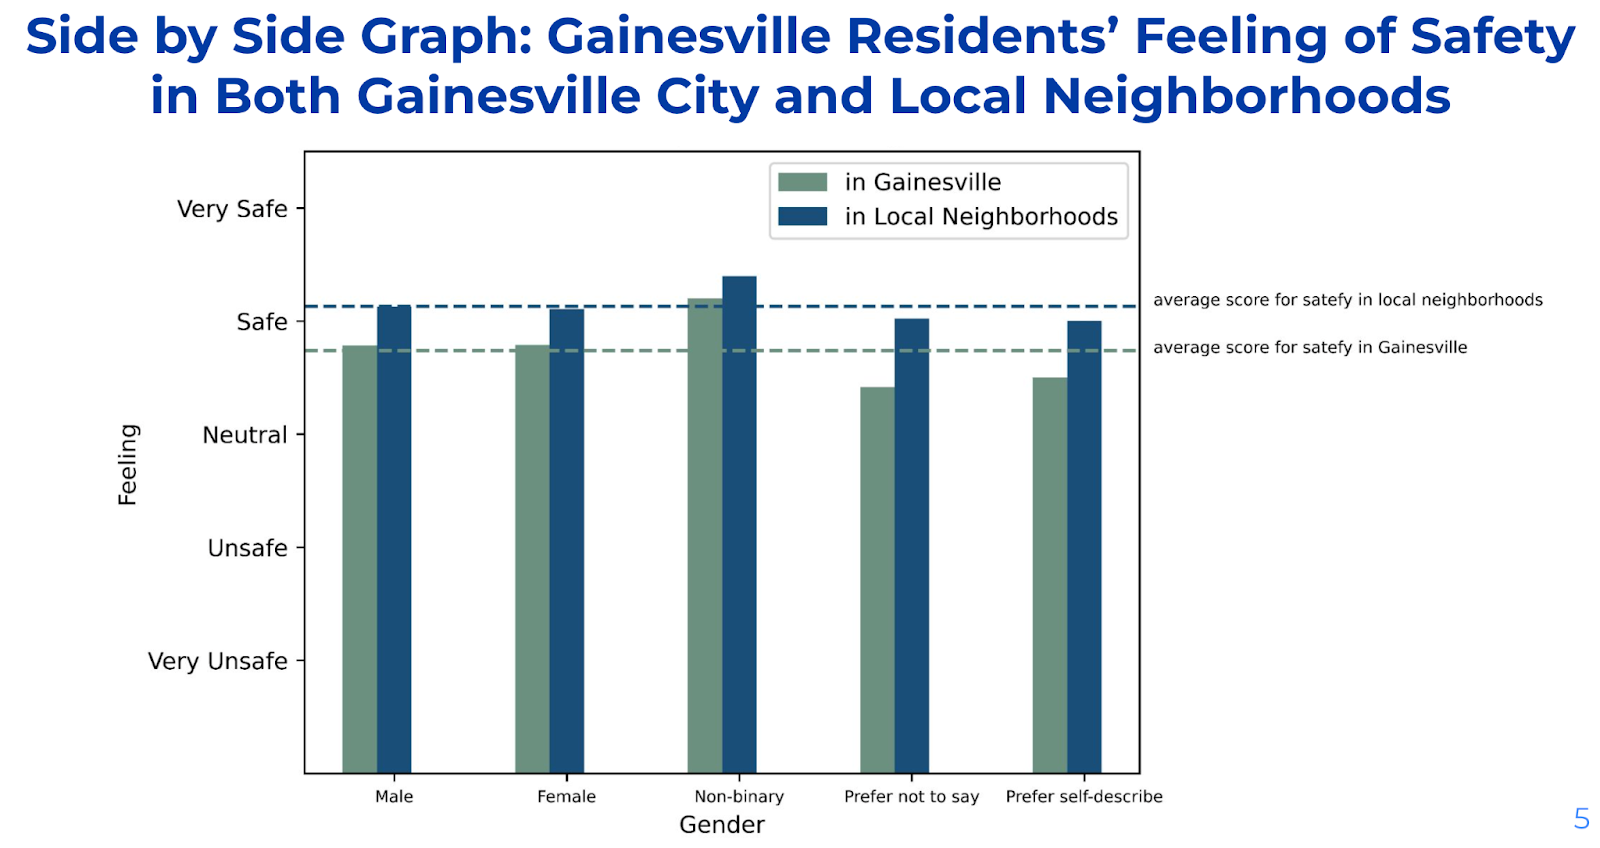
This bar graph, sourced from the 2021 Gainesville Neighborhood Survey on the GNV Open Data Portal, shows how residents of different genders perceive their safety in Gainesville and local neighborhoods. In the 2021 Gainesville Neighborhood Survey, local neighborhood was defined as the area/community someone lives in everyday. Residents who prefer not to disclose or residents who self identified their gender reported safety scores well below the average, while non-binary residents reported the highest safety scores for both Gainesville and their community, which may be attributed to the relatively small sample size for non-binary respondents. It is also possible that some non-binary residents may not feel safe reporting that they are non-binary, and instead chose to self-describe their gender or not disclose their gender altogether.
The graph also suggests that Gainesville, as a college town with a more progressive environment, may be more accepting of diverse gender identities and thus more welcoming to those individuals. Further research is necessary to better understand how gender impacts residents’ feelings of safety in Gainesville and their local communities, and even which local communities may feel safest for transgender and nonbinary people. Local governments can take several actions to enhance safety for the transgender and nonbinary residents of Gainesville. These might include creating more gender-neutral public facilities, such as restrooms and changing rooms, providing education and training for government officials and employees on gender inclusivity, and supporting local organizations that work to address issues affecting gender minorities.
Comparison of Arrest Charges by Sex
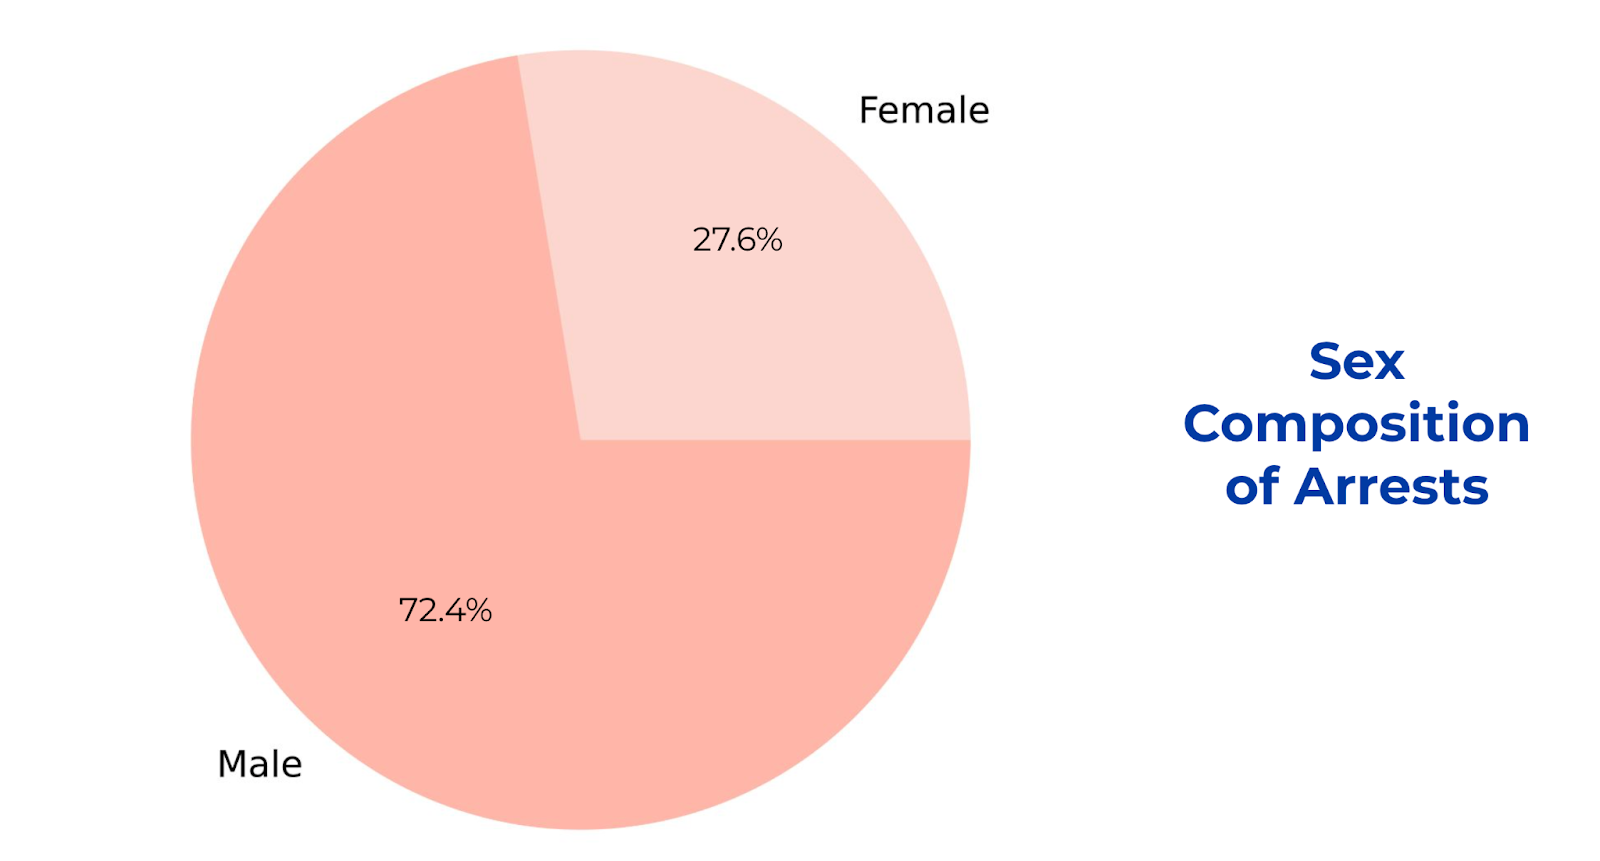
This pie chart analyzes sex composition of arrest charges in Gainesville since 2011. The data points come from the arrests dataset in GNV open data portal. According to this visualization, the majority – around 75% – of charges were to male arrestees.
While this statistic may be concerning, it is important to consider the underlying factors that may contribute to this gender disparity. In her study, Audrey Omar concluded that one factor that may contribute to this gender disparity is the prevalence of gendered role models in our society. Men are often socialized to be more aggressive and competitive, which may increase their likelihood of engaging in violent or criminal behavior.1
However, it is important to not generalize these results to before the crimes are committed, as that could be considered profiling. Statistics are important to understand our community, but reality is often more nuanced, and that fact must always be considered before assumptions are made. Comments indicated that this visualization could be further broken down, and below are visualizations for various races.

Comparison of Arrest Charges by Race and Sex
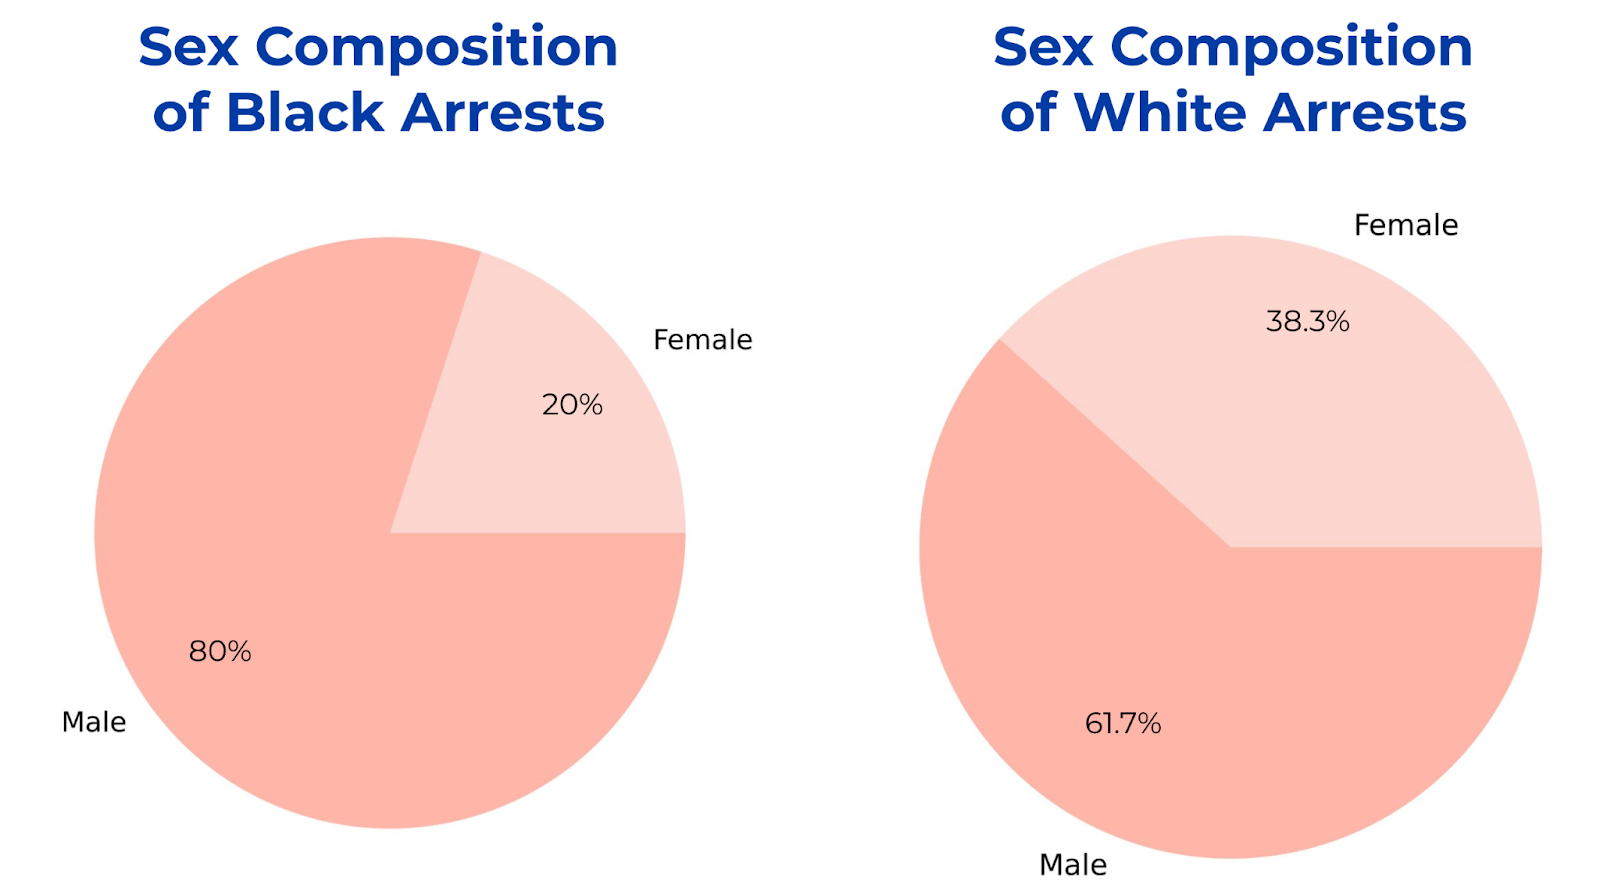
From this pair of graphs, we can see that the trend persists across black and white population. Some at the data walk inquired as to why only two races are presented in this visualization. Unfortunately, there were limited data points for other races, which were not enough to accurately represent the whole population without a high discrepancy for error.
The government can provide support for at-risk populations – particularly young people and those experiencing poverty – who may be more likely to engage in criminal behavior, according to a 1995 study by John Graham and Benjamin Bowling.2 This could include investing in education and job training programs, mental health services, and other resources that can help individuals address the root causes of their criminal behavior.
Future research could compare the locations of arrests between races to assess the impact of practices that increase inequity and undermine economic stability and family, such as redlining. According to the Cornell Law School Legal Information Institute, “Redlining can be defined as a discriminatory practice that consists of the systematic denial of services such as mortgages, insurance loans, and other financial services to residents of certain areas, based on their race or ethnicity.”
MyGNV Service Requests
Zan Valere

Gainesville’s service request system, myGNV, is mostly used by residents to report environmental and road work concerns. DataGNV’s information on the distribution of service requests by request type shows how often certain types of services are requested by the public. Most of the services in the data relate to safety and ambience, which shows that they are priorities for the community.
By acknowledging the most common request types, local authorities can allocate resources and prioritize their efforts to address these issues effectively.

Looking at the different request types, traffic/pedestrian signals and other road-related requests have the longest processing time, despite being the most requested.
Given the potential complexity of the requests, regulatory procedures, and pedestrian access, city officials should streamline efforts and enhance coordination to improve processing time. Gainesville can use additional resources to address and understand the high volume of road-related requests, which will ensure that these important requests are processed in a timely manner to improve overall road safety and the efficiency of transportation infrastructure.

Time to acknowledge and close requests varies based on the type of request received by police and which sector received the call.
From the myGNV data, the departments serving the geographic areas titled Police Sector 1 appear to be the most efficient in terms of closing minutes to acknowledge requests. Further investigation would be required to understand why Police Sector 1 is the most efficient.
On the other hand, Police Sector 2 followed by Sector 3 appear to be the least efficient, with longer closing minutes. In one jurisdiction, the study “What Conditions Affect Police Response Time? Examining Situational and Neighborhood Factors” was conducted and found that the complainant’s demographic information, situational factors, and neighborhood characteristics all seem associated with police response time.
Analyzing the variations in closing minutes across police sectors can help identify potential improvements in resource allocation, procedural efficiency, and training needs. By addressing these factors, police sectors can work towards improving their response times and ensuring more equitable and efficient handling of different types of requests across all areas.

What now?
We at Florida Community Innovation had a simple goal with this project: create transparency between the government and the people about what is going on in our community. This blog post aims to realize that goal, helping you understand the inner workings of the city of Gainesville. Whether it is through understanding traffic, crime, emergency services, or the things we care about the most, this data can be a guide for getting to know Gainesville a little better, and potentially lead to conversations that can drive change.
With the raw information provided to us by the Gainesville Open Data Portal, we strove to reflect only the data itself, and not preconceived notions and inherent biases. Through further review and research – by the City, FCI, the University of Florida, and citizens like yourself – we can refine our knowledge and conclusions to best help our community.
Statistics are one tool we can use to understand the potential of our community. As a city, both people and government: let’s come together and build. If pedestrians are endangered by car crashes on certain streets, let’s build bridges, crosswalks, sidewalks, and stop-signs. Already, FCI is building an app that gives people the fastest, safest route to their destination on foot. If people are requesting to repair roads and street lights the most, let’s build a more robust infrastructure. If one criminal charge seems most common, like theft or drug use, let’s work to address the issues that lead to these crimes – like poverty and addiction – by building resources to get people the help they need. Data helps us understand our community, but this community can go beyond understanding, and create real solutions that will make a difference in our own backyards.
Of course, solutions will never be that simple. However, if this data can light the path toward progress, it will have done its job. Thank you so much for reading about our Data Walk, the product of our hard working and creative students. We are so grateful for your time, and look forward to what you can do with this data in this great community we call home.
About our authors

Holden Alpern
Holden is a freshman at the University of Florida, pursuing a dual degree in History and Business while working as a Personal Trainer at RecSports. In his second semester of FCI, he focuses on securing grants and data analysis, and looks forward to continuing this work throughout his college career.

Abhiram Bommineni
Abhiram is a rising sophomore at the University of Florida, pursuing a dual degree in Economics and Mathematics. He is passionate about conducting economic research with clear implications towards law and public policy. He has enjoyed exploring the inner-workings of a non-profit as well as creating data visualizations addressing societal needs.

Muning Chen
Muning is a junior at the University of Florida. She has a major in data science and two minors in computer science and sociology while pursuing the AI certificate. She cares about using technology to address social issues and this is why she enjoys working on the data analysis team and web development team at FCI.

Zan Valere
Zan is an International student and rising sophomore majoring in data science with a minor in Mass Communication Studies. She has a particular interest in the intersection of her studies, focusing on data visualization, communication, and marketing, with a special emphasis on the non-profit sector, in which she has gained valuable experience.

Qingyu Yang
Qingyu Yang is a rising junior at the University of Florida, majoring in advertising and minoring in statistics. Qingyu is eager to combine her data analytical skills with communication and marketing experience in her future career. She is interested in exploring how cultural and social elements could shape the market and ways of communication.
Images from the data walk are courtesy of Ikram Loutfi Photography.
Images from the data walk are courtesy of Ikram Loutfi Photography.


Leave a Reply